Important coffee statistics
- Americans spend $48 billion at coffee shops annually
- US Seniors drink three times more coffee than their younger counterparts
- 48 percent of coffee drinkers say they have it because of the caffeine
The United States of coffee
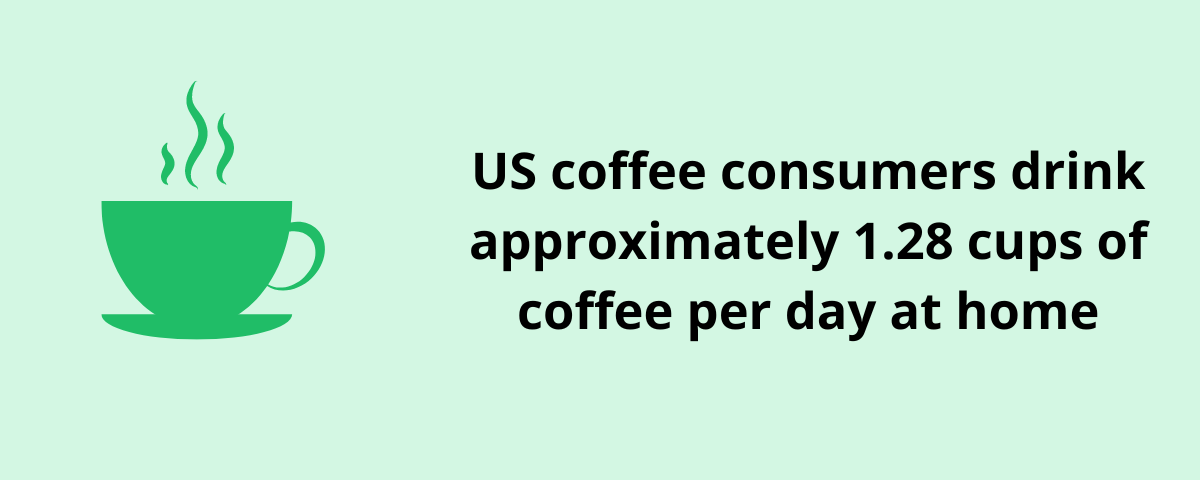
US coffee consumers drink approximately 1.28 cups of coffee per day at home. Others drink less when outdoors. However, they drink a fifth of a cup while at work or going out to eat.
In terms of who’s drinking the most coffee on a region-by-region (and state-by-state) basis, let’s take a look at the following:
- The Northeastern United States drinks about 1.97 cups of coffee per day. In the number two spot is the South, where people drink 1.8 cups.
- Vermont is considered to be the most caffeinated state in the US.
- With one shop for every 2559 people, Hawaii has the most coffee shops in comparison to the population.
- Washington State has the most coffee shops per capita with 54.1 for every 100.000 people. Seattle is home to the global headquarters of Starbucks.
- Oregon has the most coffee manufacturers of any state in the country.
- Colorado ranks the highest for the Google keyword term ‘coffee shops near me’ from the previous five years. Using the same data, Denver ranks in the top five when broken down by metropolitan areas. The Bozeman-Butte, MT area is top-ranked.
- New York State has 764 coffee shops throughout the state. That’s more than triple what the entire city of Seattle has (which is around 337).
- San Francisco has the most coffee shops per square mile (8.3).
- The entire state of California claims one of the highest percentages of adult coffee drinkers. Some of their cities also lead in the following categories: average spending on coffee per household and percentage of households that own coffee makers.
- The Miami-Dade, FL area has the lowest average price per pack of coffee.
Sources: Zippia, Google Trends, WalletHub
Preferred coffee type by state
Iced coffee is the favorite in 28 states making it the most popular by a wide margin. It’s followed by cold brew being the favorite in 8 states, and black coffee in five.
| State | Most popular coffee |
| Alabama | Iced coffee |
| Alaska | Cold brew |
| Arizona | Black coffee and cold brew |
| Arkansas | Iced coffee |
| California | Decaf |
| Colorado | Cold brew |
| Connecticut | Iced coffee |
| Delaware | Iced coffee |
| Florida | Cappuccino |
| Georgia | Iced coffee |
| Hawaii | Cold brew |
| Idaho | Black coffee |
| Illinois | Iced coffee |
| Indiana | Iced coffee |
| Iowa | Iced coffee |
| Kansas | Cappuccino and iced coffee |
| Kentucky | Iced coffee |
| Louisiana | Iced coffee |
| Maine | Iced coffee |
| Maryland | Decaf |
| Massachusetts | Iced coffee |
| Michigan | Decaf |
| Minnesota | Latte |
| Mississippi | Cappuccino |
| Missouri | Iced coffee |
| Montana | Black coffee |
| Nebraska | Iced coffee |
| Nevada | Cold brew |
| New Hampshire | Decaf and iced coffee |
| New Jersey | Iced coffee |
| New Mexico | Decaf |
| New York | Cappuccino |
| North Carolina | Iced coffee |
| North Dakota | Iced coffee |
| Ohio | Iced coffee |
| Oklahoma | Cappuccino |
| Oregon | Cold brew |
| Pennsylvania | Iced coffee |
| Rhode Island | Iced coffee |
| South Carolina | Iced coffee |
| South Dakota | Iced coffee |
| Tennessee | Iced coffee |
| Texas | Iced coffee |
| Utah | Black coffee |
| Vermont | Cold brew |
| Virginia | Decaf |
| Washington | Cold brew |
| West Virginia | Iced coffee |
| Wisconsin | Iced coffee |
| Wyoming | Black Coffee |
Source: Taste of Home
What city has the most expensive (and cheapest) cup of coffee?
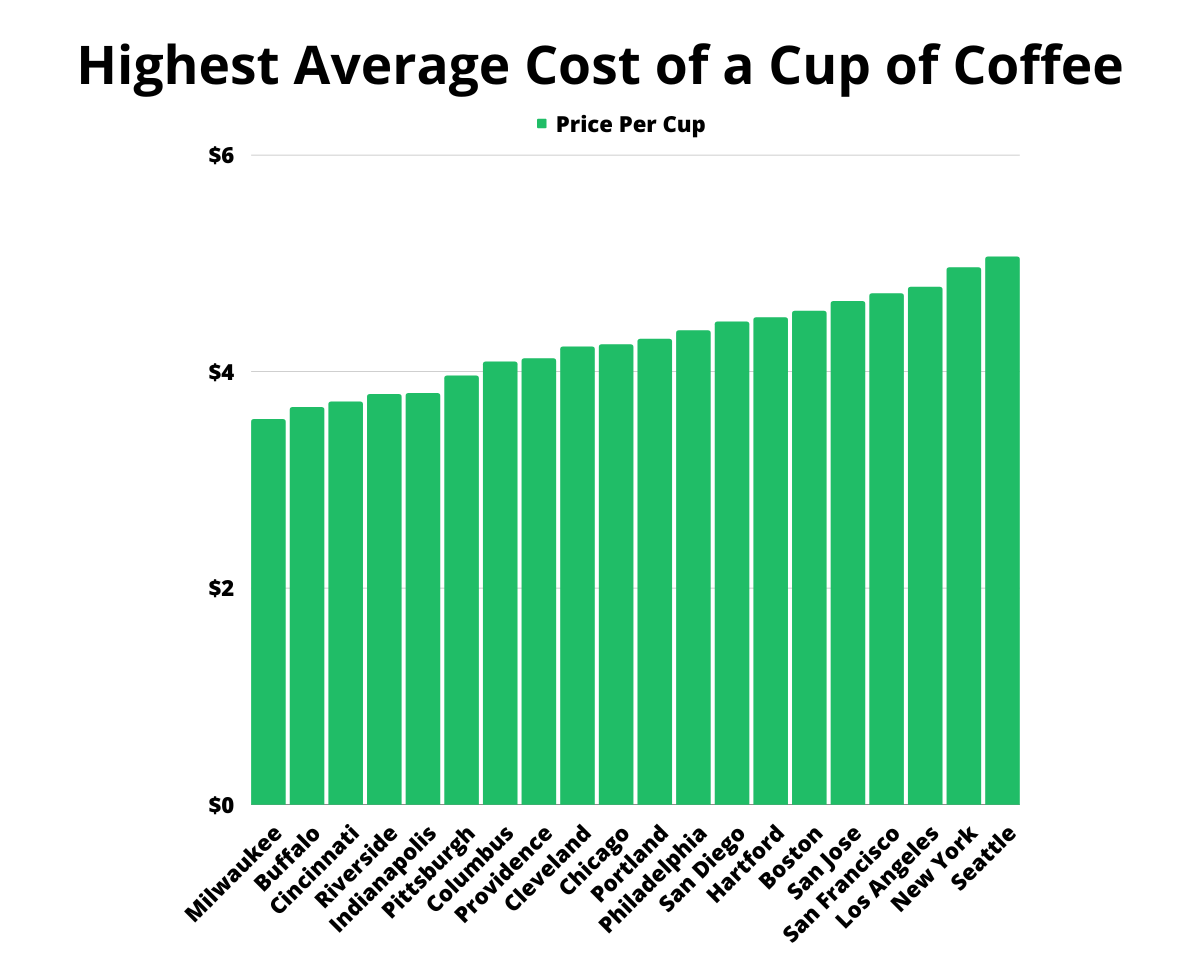
Top 20 US Cities with the Highest Average Cost of a Cup of Coffee
Seattle is home to the most expensive cup of coffee, coming in at $5.06.
| US City | Price Per Cup |
| Milwaukee, WI | $3.56 |
| Buffalo, NY | $3.67 |
| Cincinnati, OH | $3.72 |
| Riverside, CA | $3.79 |
| Indianapolis, IN | $3.80 |
| Pittsburgh, PA | $3.96 |
| Columbus, OH | $4.09 |
| Providence, RI | $4.12 |
| Cleveland, OH | $4.23 |
| Chicago, IL | $4.25 |
| Portland, OR | $4.30 |
| Philadelphia, PA | $4.38 |
| San Diego, CA | $4.46 |
| Hartford, CT | $4.50 |
| Boston, MA | $4.56 |
| San Jose, CA | $4.65 |
| San Francisco, CA | $4.72 |
| Los Angeles, CA | $4.78 |
| New York, NY | $4.96 |
| Seattle, WA | $5.06 |
Source: CashNetUSA
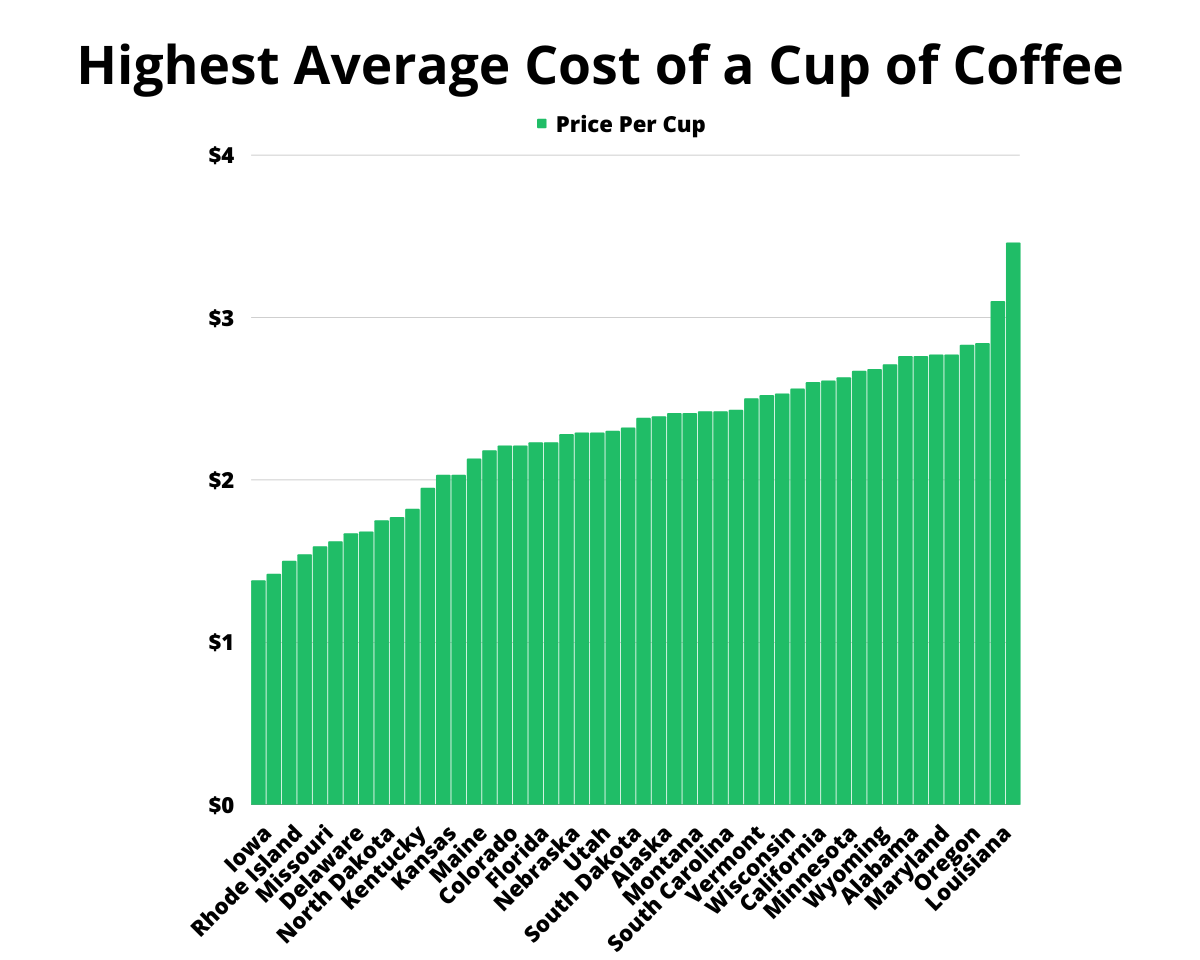
State-by-State Comparison of Average Coffee Prices Per Cup
Washington has the highest average for a cup of coffee in all 50 states at $3.46.
Iowa has the lowest average price at $1.38.
| State | Price per cup |
| Alabama | $2.76 |
| Alaska | $2.39 |
| Arizona | $1.95 |
| Arkansas | $2.61 |
| California | $2.60 |
| Colorado | $2.21 |
| Connecticut | $2.67 |
| Delaware | $1.67 |
| Florida | $2.23 |
| Georgia | $2.30 |
| Hawaii | $2.41 |
| Idaho | $2.18 |
| Illinois | $2.76 |
| Indiana | $2.84 |
| Iowa | $1.38 |
| Kansas | $2.03 |
| Kentucky | $1.82 |
| Louisiana | $3.10 |
| Maine | $2.13 |
| Maryland | $2.77 |
| Massachusetts | $2.71 |
| Michigan | $1.77 |
| Minnesota | $2.63 |
| Mississippi | $2.29 |
| Missouri | $1.59 |
| Montana | $2.41 |
| Nebraska | $2.28 |
| Nevada | $2.23 |
| New Hampshire | $1.42 |
| New Jersey | $1.54 |
| New Mexico | $2.56 |
| New York | $2.43 |
| North Carolina | $2.42 |
| North Dakota | $1.75 |
| Ohio | $1.68 |
| Oklahoma | $2.21 |
| Oregon | $2.83 |
| Pennsylvania | $2.38 |
| Rhode Island | $1.50 |
| South Carolina | $2.42 |
| South Dakota | $2.32 |
| Tennessee | $2.77 |
| Texas | $2.52 |
| Utah | $2.29 |
| Vermont | $2.50 |
| Virginia | $2.03 |
| Washington | $3.46 |
| West Virginia | $1.62 |
| Wisconsin | $2.53 |
| Wyoming | $2.68 |
Source: Clever Real Estate
Top 10 States with the Highest Coffee Consumption
Michigan loves their coffee so much that they’ll drink an average of 2.52 cups per day. Meanwhile, Arkansas and South Carolina drink about the same amount at 2.12 cups.
| State | Cups of Coffee Per Day |
| Louisiana | 2.03 |
| Maine | 2.05 |
| Kansas | 2.07 |
| Arkansas | 2.12 |
| South Carolina | 2.12 |
| Nebraska | 2.13 |
| Ohio | 2.16 |
| West Virginia | 2.35 |
| Delaware | 2.44 |
| Michigan | 2.52 |
Top 10 States with the Lowest Coffee Consumption
Utah leads the way with the least cups of coffee consumed. Wisconsin and Hawaii share a common bond at one and a half cups daily - despite being polar opposites weatherwise.
| State | Cups of Coffee Per Day |
| Mississippi | 1.58 |
| Maryland | 1.57 |
| Georgia | 1.54 |
| Wisconsin | 1.52 |
| Hawaii | 1.52 |
| Massachusetts | 1.51 |
| New Jersey | 1.45 |
| Minnesota | 1.32 |
| Arizona | 1.30 |
| Utah | 1.29 |
Source: SimpleTexting
How much money is spent on coffee (supermarkets vs coffee shops)?
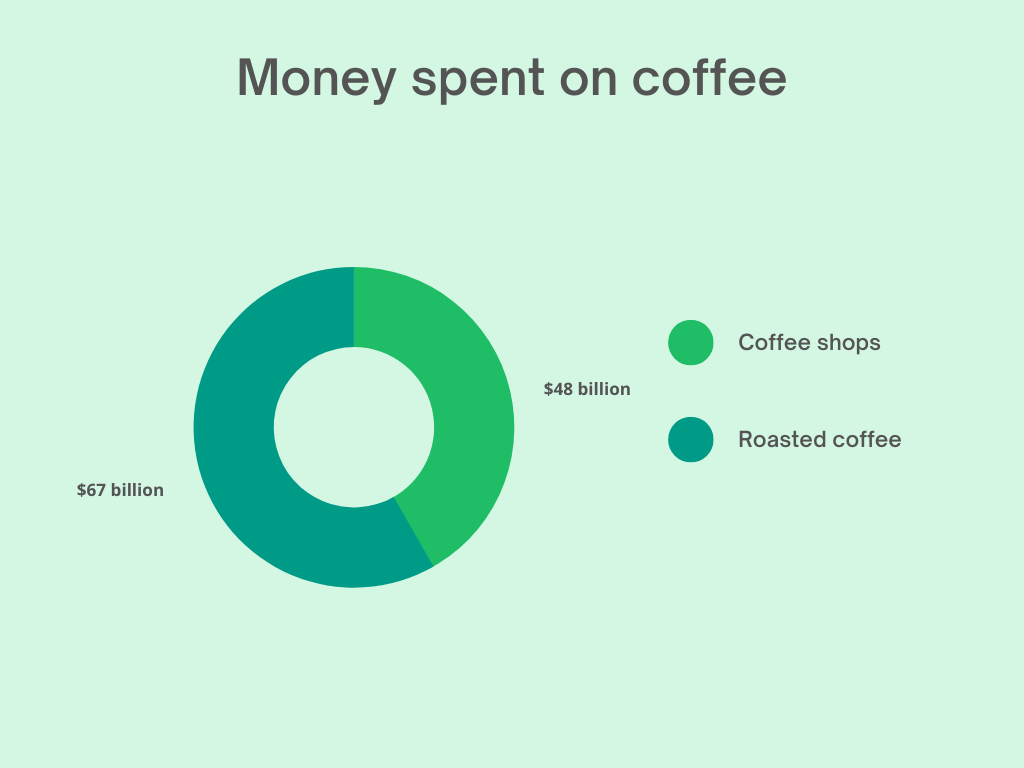
People in the United States spend $48 billion each year in coffee shops. Starbucks and Dunkin’ alone account for half of the sales.
Compare that to nearly $67 billion of revenue for the roasted coffee market. This is likely the kind of coffee that people will purchase in grocery stores.
Total Amount Of Coffee Spending in Previous 10 Years (2012-2022)
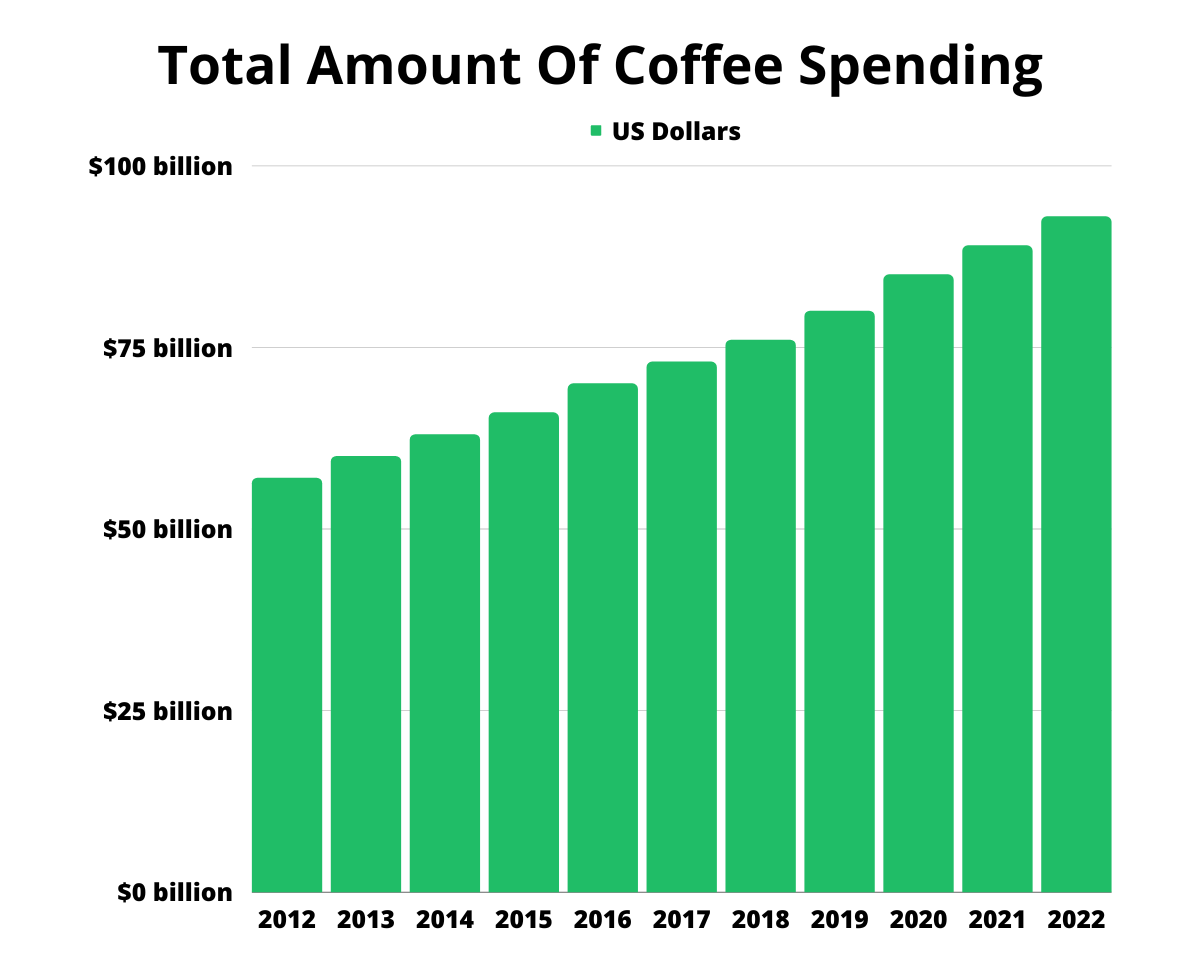
| Year | Total (in US Dollars ; Billions) |
| 2012 | $57 billion |
| 2013 | $60 billion |
| 2014 | $63 billion |
| 2015 | $66 billion |
| 2016 | $70 billion |
| 2017 | $73 billion |
| 2018 | $76 billion |
| 2019 | $80 billion |
| 2020 | $85 billion |
| 2021 | $89 billion |
| 2022 | $93 billion |
Source: Brew Smartly
“What do we want? Coffee! When do we need it? Now!”: The Personal Numbers
Have you ever wondered which group of people are most drawn to coffee? Do you ever wonder what the reasons are why people drink it? This section will answer those questions.
To begin, let’s take a look at the breakdown based on different age groups:
- Persons between the ages of 25 to 34 spend the most money on coffee each year. Approximately $2008 to be exact.
- Half of the people ages 18 to 24 drink coffee. However, 70 percent of the US senior population does the same. People over 70 drink at least 2.18 cups per day. In fact, seniors drink triple the amount compared to their younger counterparts.
- Coffee shops draw in the 18 to 24 and 25 to 34 age groups. Most of the customers are male.
- Coffee drinkers from 35-44 and 45-54 will purchase coffee online. Most of the customers are female.
- The average earning income for people who order coffee online is $75,000 or more.
Source: Statista
How many cups of coffee do we drink per day?
On average, we consume 1.81 cups of coffee per day, which amounts to 12.67 cups per week, 50.68 cups per month, and a whopping 608.16 cups per year.
In a neck and neck battle between two age groups, the 25-29 crowd drinks slightly more coffee than the 70+ age bracket. The consumption amount drops within the 30-39 crowd, however.
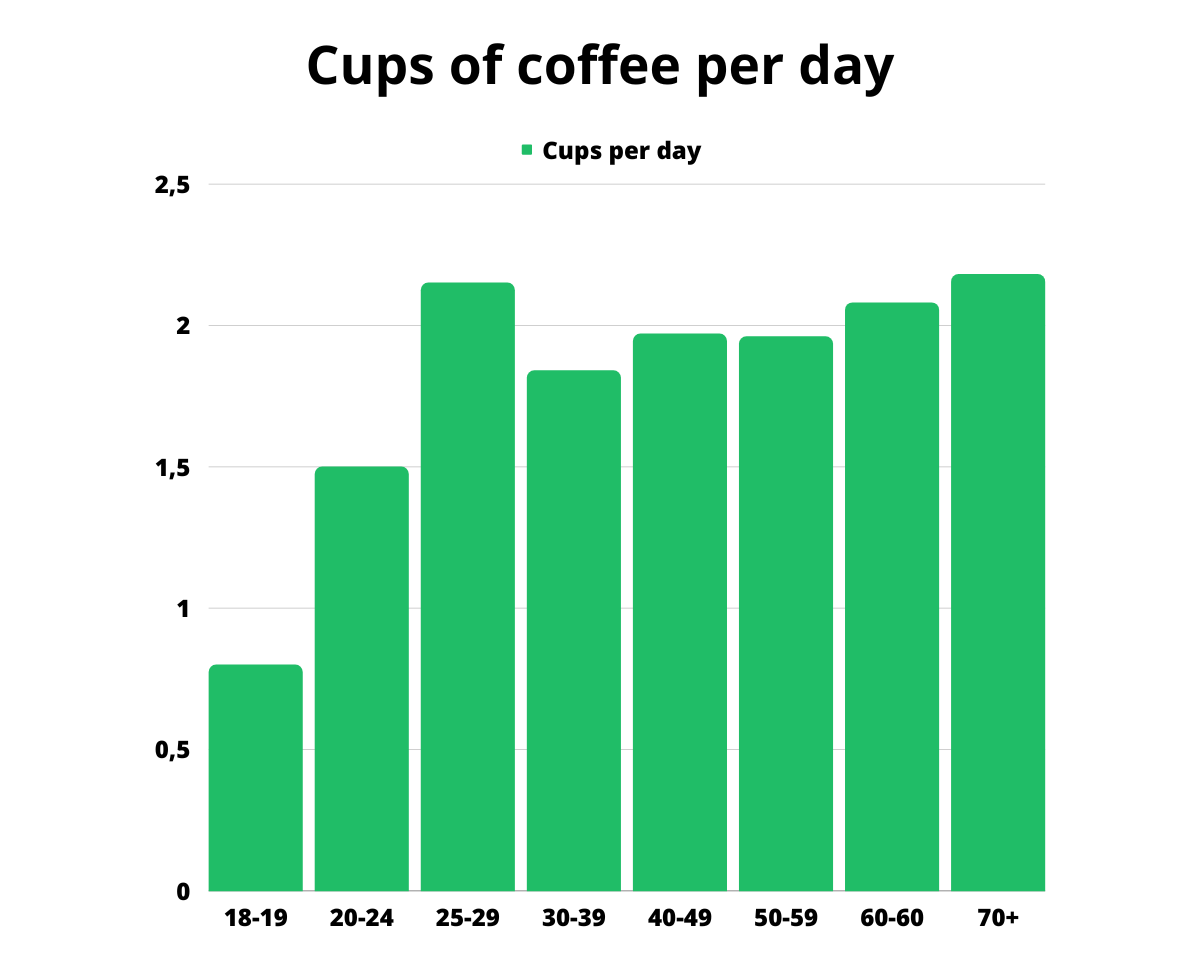
| Age group | Cups per day |
| 18-19 | 0.8 |
| 20-24 | 1.5 |
| 25-29 | 2.15 |
| 30-39 | 1.84 |
| 40-49 | 1.97 |
| 50-59 | 1.96 |
| 60-60 | 2.08 |
| 70+ | 2.18 |
Source: Statista
How many households own a coffee machine?
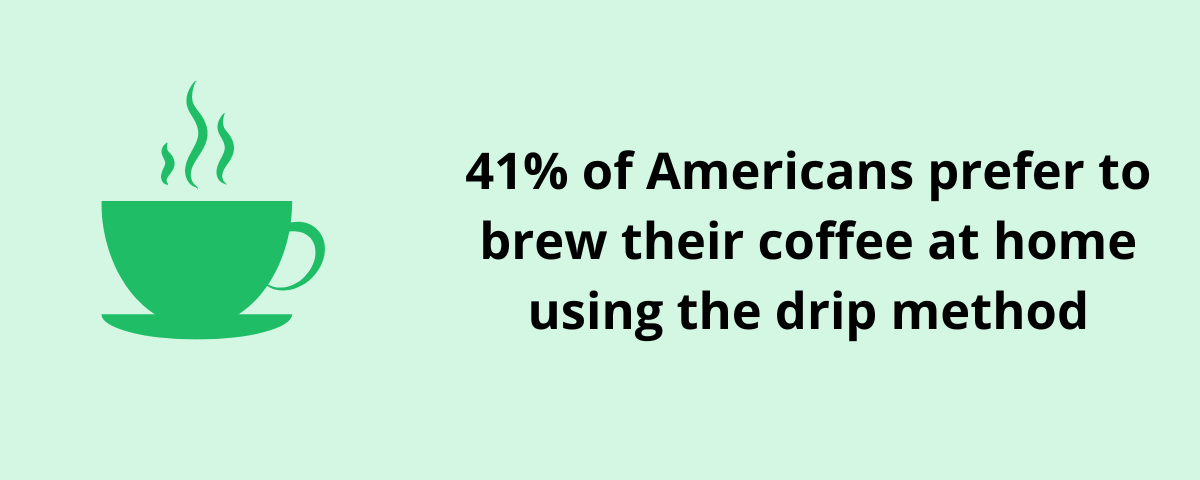
Drip coffee machines still reign supreme in US households at 41 percent. Single cup machines are now at 27 percent, but that number could rise in the future.
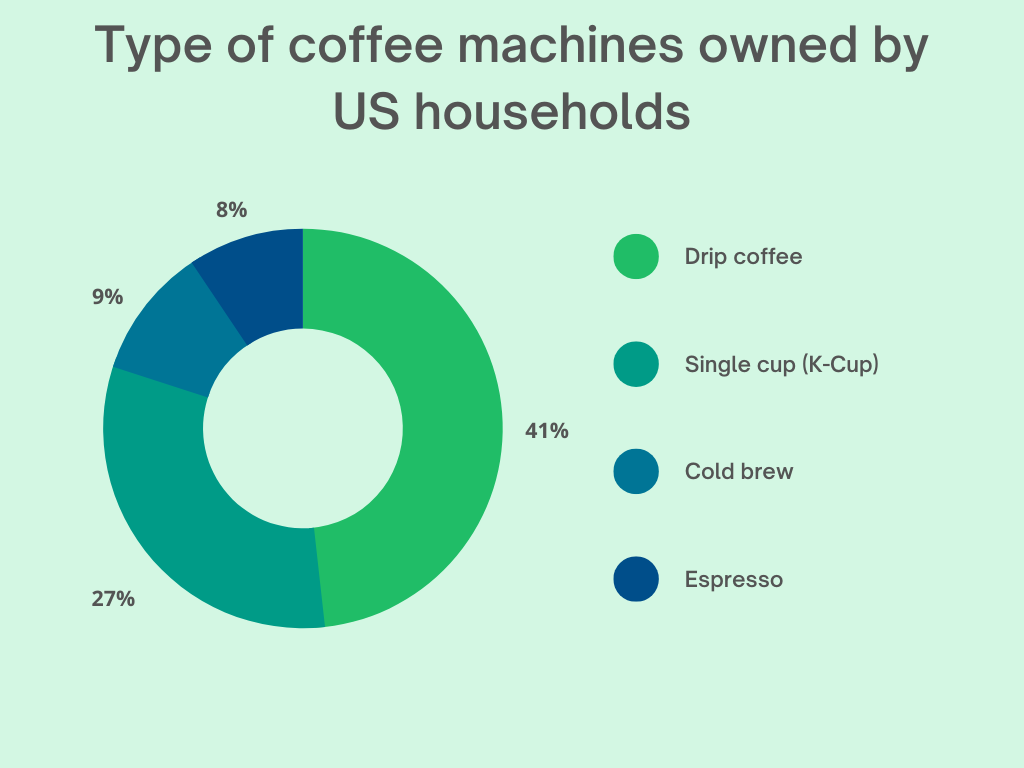
| Coffee Machine (by type) | Percentage of US households |
| Drip coffee | 41% |
| Single cup (K-Cup) | 27% |
| Cold Brew | 9% |
| Espresso | 8% |
Who drinks the most coffee?
Hispanics drink the most coffee with a percentage of 64%. This is followed by the Asians/Pacific Islanders with 59%. The ethnicity that drinks the least amount of coffee is African Americans.
By ethnicity
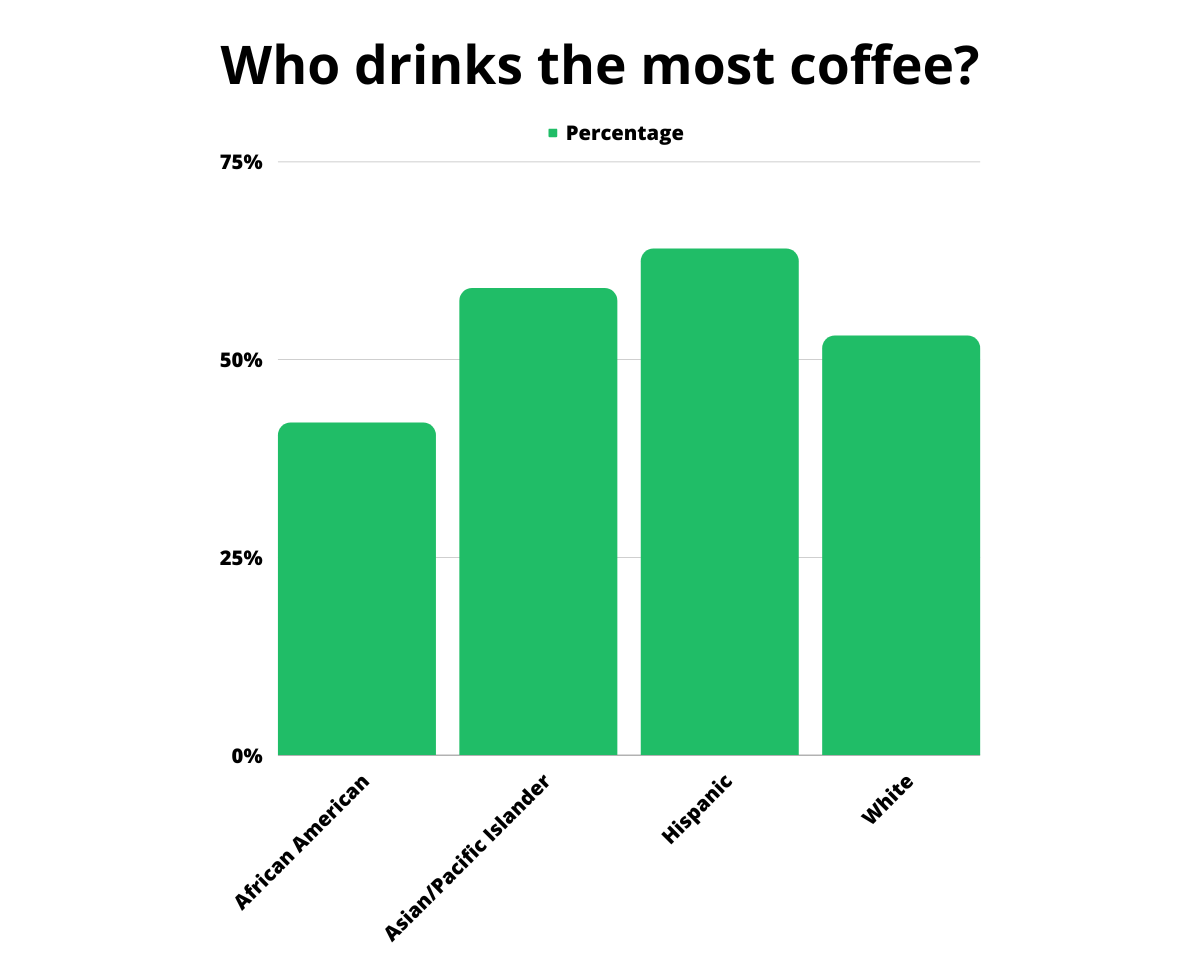
| Race type | Percentage |
| African American | 42% |
| Asian/Pacific Islander | 59% |
| Hispanic | 64% |
| White | 53% |
Source: Daily Coffee News
By profession
- In a survey of 10,000 professionals, 85 percent drink at least three cups of coffee per day.
- Male professionals drink five percent more coffee than their female counterparts.
- 70 percent say that they won’t be able to function properly at work without at least one cup of coffee per day.
The best times of day to drink coffee
| Good time to drink coffee | Bad time to drink coffee |
| Before 8AM (if an early riser) | 8AM to 9AM |
| 9AM-11:30 AM | 12PM to 1PM |
| 1PM-5PM | After 5PM (unless you work nights) |
Source: JavaPresse
With the exception of early risers and night owls, the table above lists the best and worst times to drink coffee. The peak best time is anytime between 9 AM to 11:30 AM.
It’s unclear how many cups of coffee are consumed at any given time of day. It should be said that 63 percent of Americans will drink their coffee during the morning hours.
Why coffee?
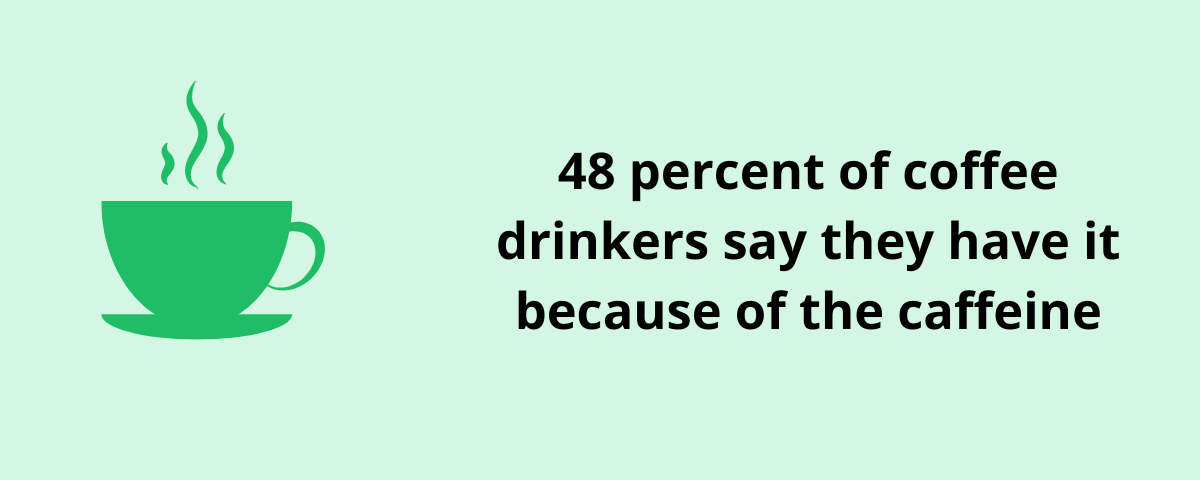
Now, let’s get to the fun part. Why are people drinking coffee? Not surprisingly, 48 percent of coffee drinkers were motivated by none other than caffeine.
Breaking it further down, 26 percent say it gives them an energy boost. About 10 percent say it helps them stay focused. Interestingly enough, 8 percent say they drink coffee as a way of being socially accepted.
But what about decaf? Where does this fit in the mix? It has its own health benefits.
There are those out there who can enjoy the taste of coffee. However, they may have caffeine sensitivity. Thus, they can opt for decaf or even ‘half-caff’ options.
While caffeine can be a blessing to many, it can be a curse for others.
Caffeine content for coffee (by chain)
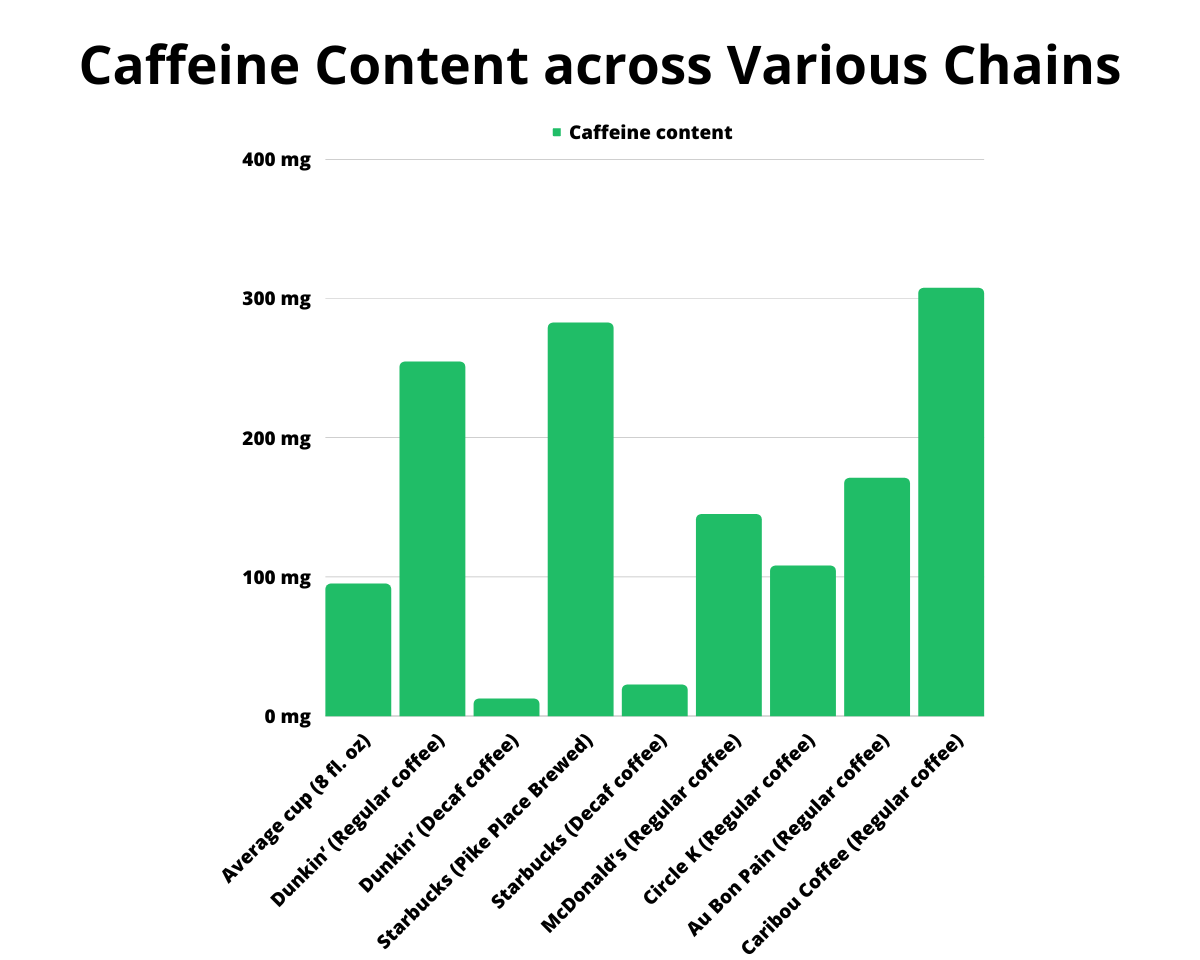
| Type of coffee | Caffeine content |
| Average cup (8 fl. oz) | 95 mg |
| Dunkin’ (Regular coffee) | 150-359 mg (Small-XL) |
| Dunkin’ (Decaf coffee) | 7-18 mg (Small-XL) |
| Starbucks (Pike Place Brewed) | 155-410 mg (Short-Venti) |
| Starbucks (Decaf coffee) | 15-30 mg (Short-Venti) |
| McDonald’s (Regular coffee) | 145 mg (16 fl oz) |
| Circle K (Regular coffee) | 108 mg (8 fl oz) |
| Au Bon Pain (Regular coffee) | 171 mg (9 fl oz) |
| Caribou Coffee (Regular coffee) | 230-385 mg (Small-Large) |
Sources: The Hartford Courant, The Commons Café, Caffeine Informer, Caffeine Informer, Caffeine Informer
An average cup of coffee at 8 ounces contains about 95 milligrams of caffeine. It may depend on the brand of coffee you may buy at the store. Meanwhile, there’s a five-milligram difference between the small sizes of Dunkin’ and Starbucks coffee.
Of course, the larger the cup size, the more caffeine. There is still some caffeine in decaffeinated coffee, albeit it a small amount. For example, Dunkin has at least 7mg for a small cup while a short decaf from Starbucks will have slightly over double the amount (15mg).
Of all the small-sized cups, Caribou Coffee had an eye-popping 230mg of caffeine. If you truly want to keep it small but need a powerful caffeinated punch, this chain will certainly deliver the goods.
Amount of caffeine in coffee (based on type)
Now that we have covered the amount of caffeine in coffee found in different chains, let’s talk about the types of coffee. How much caffeine does cold brew have compared to regular? Let’s find out using the chart below:
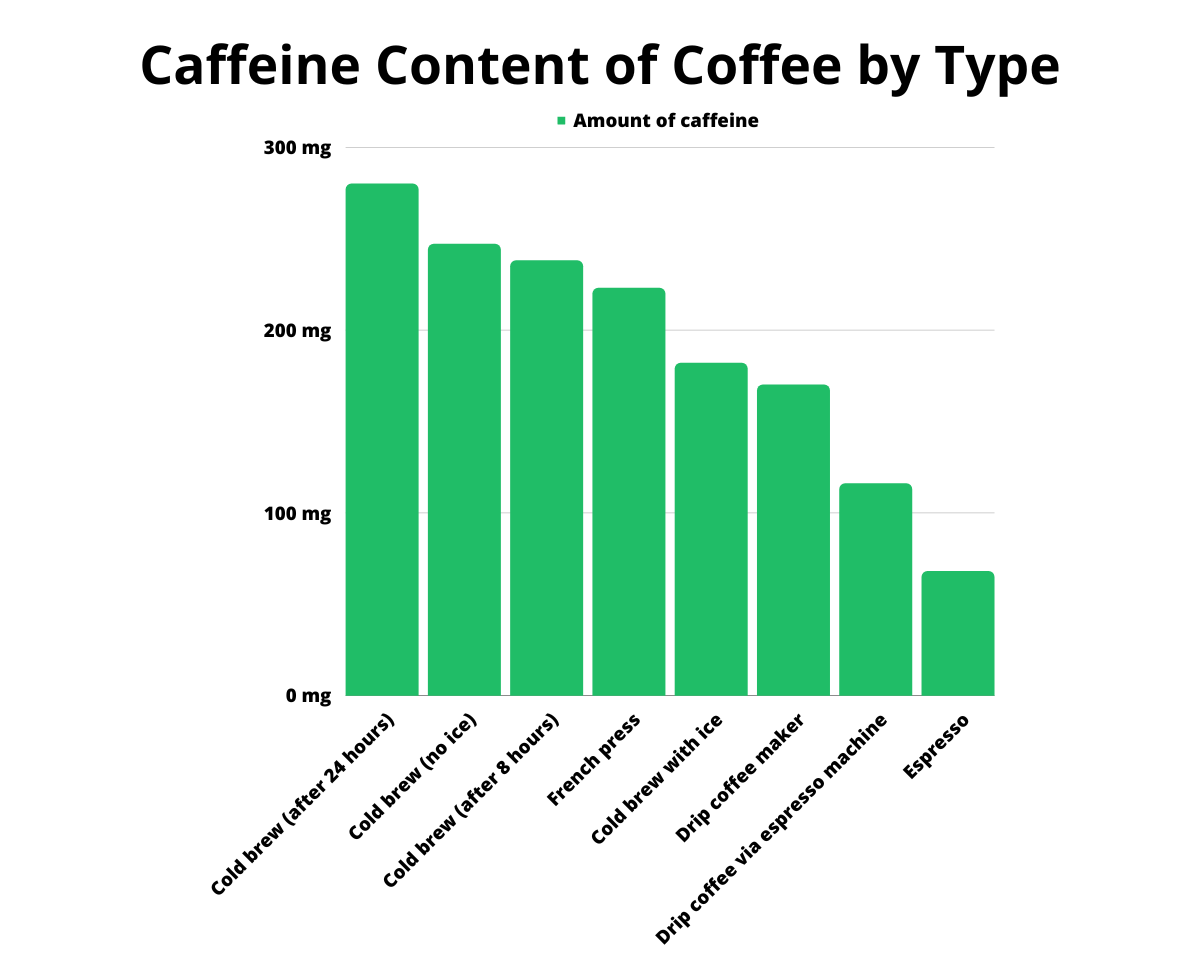
| Type of coffee | Amount of caffeine |
| Cold brew (after 24 hours) | 280 mg |
| Cold brew (no ice) | 247 mg |
| Cold brew (after 8 hours) | 238 mg |
| French press | 223 mg |
| Cold brew with ice | 182 mg |
| Drip coffee maker | 170 mg |
| Drip coffee via espresso machine | 116 mg |
| Espresso | 68 mg |
Source: Golden Ratio Coffee
As you may have noticed, cold brew after 24 hours takes the crown for most caffeine. In fact, it goes no less than 182 mg. Thus, it might add one more reason why people might enjoy it so much.
If you are adamant about drinking it hot (and we won’t blame you), French Press will be your best option. It will have at least 223mg. Drip coffee will have 170mg, even though it will be 54mg less if done using an espresso machine.
Lastly, standalone espresso is the lowest at around 68mg.
Coffee at home: Most Popular Brewing Methods
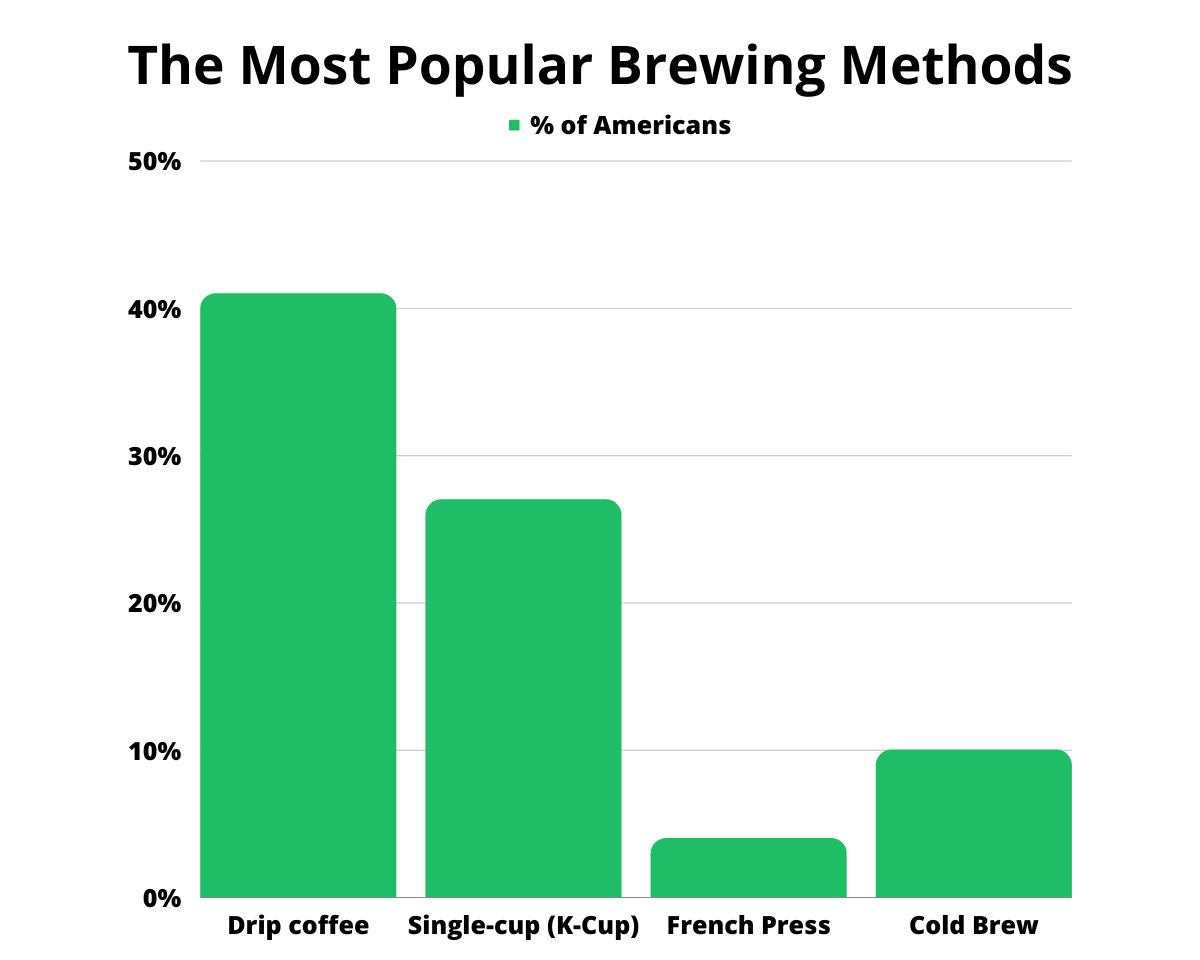
| Type of brewing method | % of Americans |
| Drip coffee | 41% |
| Single-cup (K-Cup) | 27% |
| French Press | 4% |
| Cold Brew | 10% |
Source: Statista
Coffee is best enjoyed right away the moment someone wakes up. This may be the key reason why most people do it at home. Believe it or not: there are several ways to make coffee at home.
Of all the methods of preparation, drip coffee making is the most popular method. In 2020, Americans who prepare coffee at home were surveyed. Of the respondents, 41 percent say they use the drip coffee method.
In 2020, 76 percent of Americans purchased coffee that has already been grounded.
Behind drip making is single-cup brewing. This is better known as using Keurig machines and their specially designed ‘K-Cups’. The method is simple and straightforward.
You drop a K-Cup or a pod into the Keurig machine and it will brew like usual. The major difference is that it requires no filters or the addition of coffee. It will make for easy cleaning and disposal.
As of 2020, 27 percent of Americans utilize this method for preparing and making coffee every morning.
The rest of the respondents were in single digits. A combined 9 percent have prepared it instantly. 7 percent used instant coffee from a can or jar while 2 percent utilized a small stick pack.
French press, one of the other preparation methods, saw four percent of respondents. Like the drip method, this method has been around for quite a long time. Despite the small percentage, it still is considered a popular method in American households.
For those who like it cold
Sure, coffee is often enjoyed hot. Yet, there are those out there who insist on drinking it cold. One of the major factors could be the climate that they are in.
It would make sense for someone to drink their coffee cold in Arizona. There are also die-hards out there that would drink coffee cold even if it was freezing cold. Some just can’t get enough of it.
Using the same survey as before, 10 percent prefer their coffee to be prepped in the cold brew style. 8 percent would drink it out of a bottle or can.
Home or on the go?
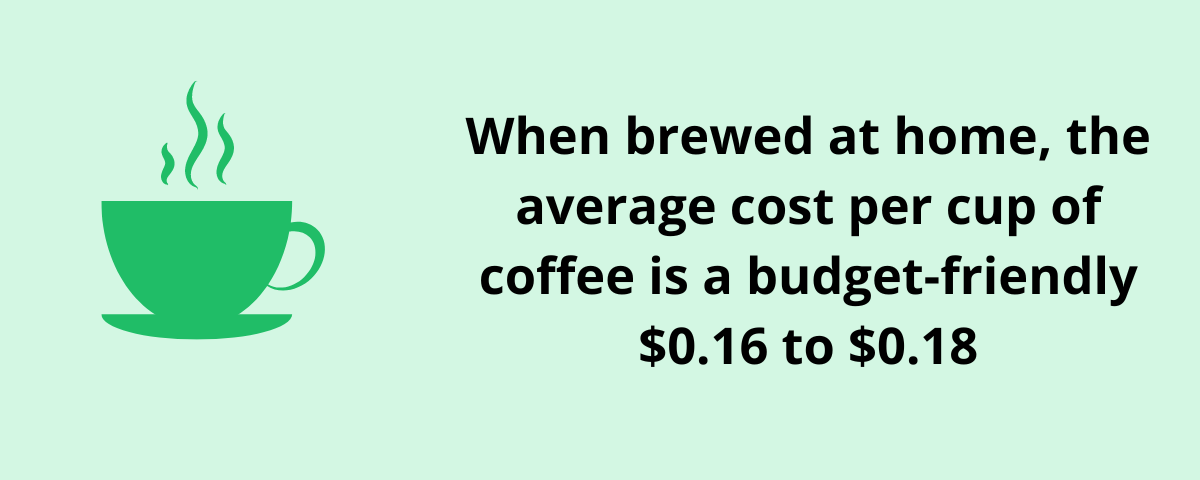
To begin, it’s no secret that those who make coffee at home place themselves at a financial advantage. The average cup at a coffee shop will range from $1 to $5. This will depend on factors such as where you’re buying it from and the size.
When made at home, the price per cup is a measly $0.16 to $0.18. This means that people who make their coffee at home are saving anywhere from $5 to $25 per week. Annually, that’s $250 to $1300 that a person saves.
Despite this, coffee shops are in the business of fast and in a hurry. No one might not have the time to make their coffee at home. So they may be willing to pony up the extra cash.
As for the percentage of how many Americans who are willing to do so? About one-third of coffee drinkers will purchase their cups from a coffee shop (at least one to three times per week).
The lowest price of coffee by chain
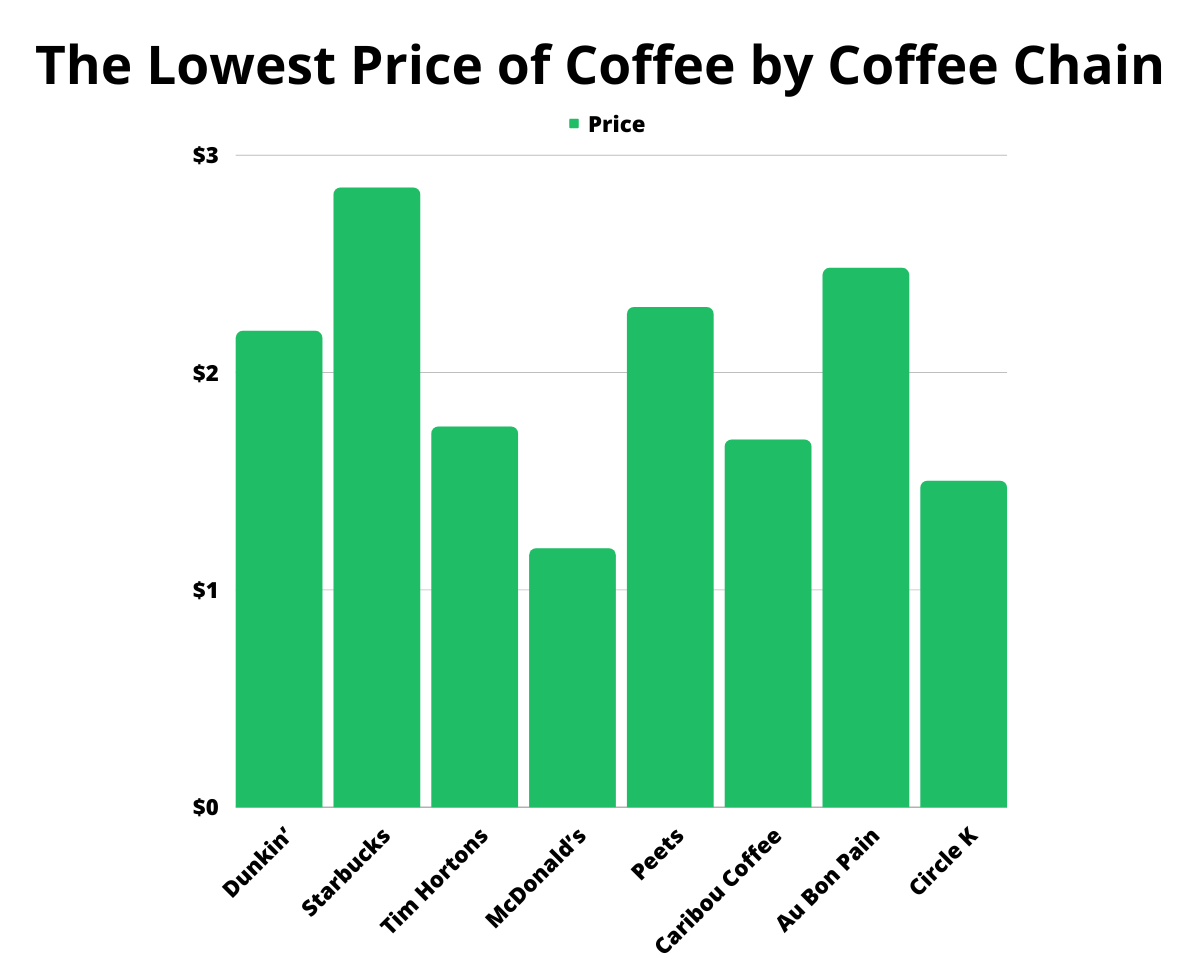
| Chain | Price |
| Dunkin’ | $2.19 |
| Starbucks | $2.85 |
| Tim Hortons | $1.75 |
| McDonald’s | $1.19 |
| Peets | $2.30 |
| Caribou Coffee | $1.69 |
| Au Bon Pain | $2.48 |
| Circle K | $1.50 |
Sources: The Commons Café, Fast Food Menu Prices, Fast Food Menu Prices, The Commons Café, TheFoodXP
In the chart above, we’ve taken three of the most popular coffee chains in the United States. We also managed to find out how much their cheapest cup of coffee was. Tim Hortons is the cheapest at the price of $1.75.
Dunkin’ clocks in at $2.19 while Starbucks is approximately 66 cents more expensive than the former. It’s over $1.10 more compared to Tim Hortons.
However, taking a look at other chains (including non-coffee shops), McDonald’s commands the lowest price at $1.19 for a small cup. Circle K, a large convenience store chain, has an average low price of $1.50 for a small cup.
However, the location of the store may also play a role in whether the price will be the same or not.
Starbucks vs Dunkin’: The Battle For US Coffee Market Share
Of the most popular chains, Starbucks and Dunkin’ are locking horns for the top spot. In one survey, 39 percent of coffee drinkers give the Seattle-based brand the edge. When compared to local coffee shops, Starbucks dominated the market.
Convenience was the number one reason why. However, this is considered to be the common denominator for those who bought coffee at shops rather than at home. Starbucks outnumbers Dunkin’ regarding the number of locations.
As of 2021, there are over 14,700 Starbucks locations in the United States. Dunkin’ has around 9400. However, both chains had experienced a slight decline in numbers from Q1 2020.
While Starbucks held steady afterward, Dunkin continued to slightly decline until the number of locations leveled off in Q4 2020. Of the two, Dunkin’ had more store expansion than Starbucks, particularly in Q2 2019.
Starbucks is planning on expanding, placing emphasis on both physical and digital customer experiences. As for the most locations by state, Starbucks continued to dominate nationwide with 37 states. In the remaining 13, there were more Dunkin’ locations than Starbucks.
Not surprisingly, Dunkin’s longtime hold on the New England region is alive and well. However, they also made their presence known in the Mid-Atlantic states. Outside of those regions, they have more locations than Starbucks in Illinois and Florida.
Broken down in a county-by-county comparison, Dunkin’s domination on the New England and Mid-Atlantic market is further confirmed. Many of the counties along the Pacific coast and inland are covered by Starbucks. In a head-to-head count, Starbucks has the most locations in 916 US counties while Dunkin’ has 493.
Coffee in Rural America
What’s even more intriguing is that 54 percent of US counties have neither a Starbucks nor a Dunkin’. This can be due to the fact that these counties are rural and sparsely populated. These counties may also be miles away from a metropolitan area where a Starbucks or Dunkin’ is typically found.
In these rural counties, local diners and coffee shops may be more in control over national chains. Regardless, Starbucks also dominates Dunkin’ in terms of its annual revenue and has done so over the past decade.
In 2020, Starbucks netted a total of $23.2 billion (close to half of the US total market value in coffee shops alone) compared to a minuscule $972 million for Dunkin’. The latter enjoyed revenue slightly above the $1 billion mark from 2016 to 2019.
Final Thoughts
Coffee has established itself as a popular beverage across different age groups. Plus, it continues to become a multi-billion dollar industry regardless of how people buy it. Many people will continue to make their coffee at home while others get it at a coffee shop.
Some may even reconsider how they get their coffee. Will it be enough for them to purchase a coffee machine and buy it from the grocery store? Only time will tell for sure.
However, the coffee shop industry has no signs of slowing down anytime soon. They may lose some customers due to saving money by making coffee at home. Yet, they are unfazed and continue to expand their efforts and generate more revenue as time goes on.